


![[LibDems]](http://www.titanictown.plus.com/hp/LibDem.png)
![[Lead]](http://www.titanictown.plus.com/hp/lead.png)
Following on from the PB article in 2006, I have now refined the Battleground Graph to show the best visual estimate of election outcomes.
The differences are small but can be summarised as follows.
i) Probabilistic Forecasting. The graph is a lot smoother than before. This is because simple UNS forecasting makes a definite win/lose projection for every seat, but the seats are not distributed uniformly along the swing axis. With simple UNS this non-uniformity produces more jagged seat forecasts, whereas probabilistic UNS assigns a probability of winning each seat, and the forecast is the sum of those probabilities. This will tend to smooth out abrupt changes in the forecast, and is mathematically more justified. This method was employed successfully in 2005 by Curtice and Firth in arriving at the '66' seat Labour majority. The marginal distribution becomes slightly unfavourable to the Tories at around the point where simple UNS says they would win a majority, to the effect of about 4 or 5 seats.
ii) I have made estimates of the likely regional deviations from the national swing. These will in all probability benefit the Tories slightly to the tune of about five seats or fewer.
iii) The LibDems may have an incumbency effect, both positive and negative, depending on whether the MP is defending a seat first won in 2005 or if the party is defending a seat where an incumbent MP is now standing down. Estimates show the net effect may save about 5 LibDem seats that might otherwise be lost.
iv) The impact of the SNP's rise in Scotland is factored in. At the moment the polls suggest they may win 3 or 4 Labour seats, and hold on to 1 or 2 others the Tories might otherwise win.
v) Labour will probably regain at least one seat currently held by Others (Bethnal Green & Bow), and may stave off defeat in another that, due to aggregation of the Other votes for the sake of simplicity, simple UNS indicates could be lost. (perhaps Burnley)
Altogether the net impact of these adjustments makes it very slightly easier for the Tories to become the largest party in seats, and very slightly harder to obtain a majority. It it also now very difficult for Labour to hold on to a majority if the Tories have any kind of lead in votes.
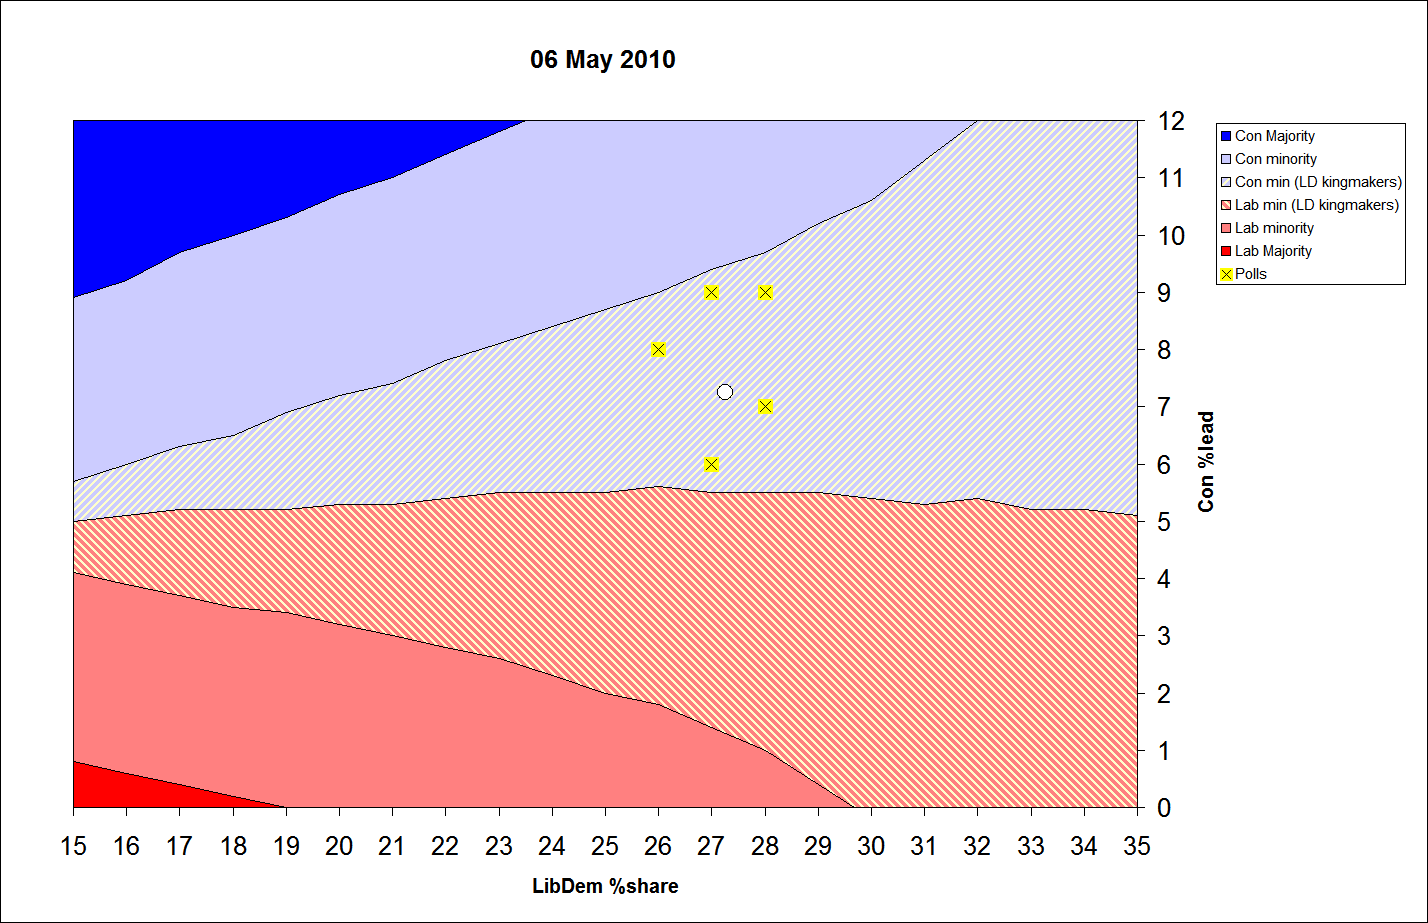
We can see that obviously, the larger lead the Tories have the easier it is for them to win a majority, but the higher the number of votes the LibDems have, the harder it becomes for the Tories. Also the hung parliament bands widen the better the LibDems do.
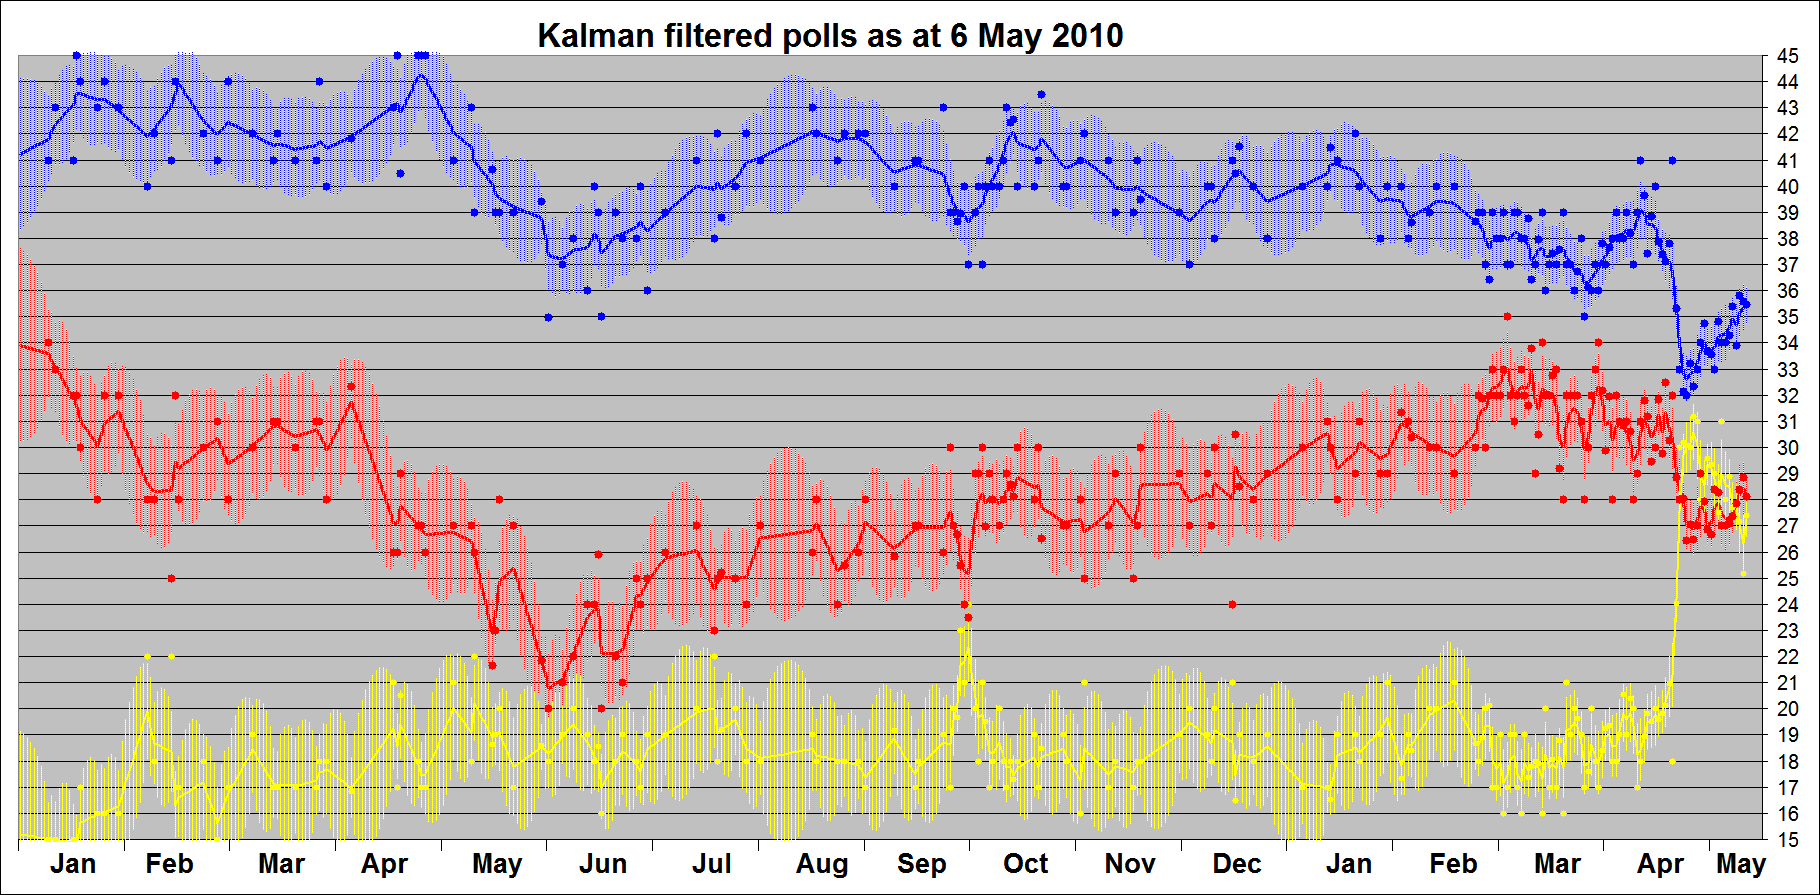
I've plotted the last six polls on the Battleground Graph, together with the Kalman-filtered average, to give a rough at-a-glance view of where the contest stands at the moment.
(I've also altered the colour scheme slightly: the LibDem Kingmaker region is still there, but instead of yellow, the colour of the largest party is predominent. In calculating whether a party has a majority or not, I assume that Sinn Fein will continue to hold 5 seats and abstain - this is favourable to the Tories to the extent of 3 seats in estimating whether they will have a majority.)
NEW - commentary recorded on 11th April 2010(I've also altered the colour scheme slightly: the LibDem Kingmaker region is still there, but instead of yellow, the colour of the largest party is predominent. In calculating whether a party has a majority or not, I assume that Sinn Fein will continue to hold 5 seats and abstain - this is favourable to the Tories to the extent of 3 seats in estimating whether they will have a majority.)
![Reblog this post [with Zemanta]](http://img.zemanta.com/reblog_e.png?x-id=c90f6f60-574c-47b2-b00b-9f1d32e44034)
Rod- is it fair to say that whilst the hung parliament bands broaden as the LD vote rises, there is more to it than that? For instance, there are seats at the deep end of the Tory target list where LD votes at the expense of Labour make a hung parliament less likely by making it easier for the Tories to win the seat eg Reading West. Also, in macro terms, a given swing from LD to Lab in many areas of the graph, including where the polls are clustering at the minute, drags the position broadly towards the origin and thus a hung parliament.
ReplyDeleteYou seem to be alluding to Tactical Voting, Hugh, which of course is the Great Unknown...
ReplyDeleteIn general, LD>Con TV (aka "unwind" of previous LD>Lab TV) will tend to shift the bands southwards to the Tories' advantage, while further Lab>LD or Con>LD TV will tend to widen the bands.
Successful Targetting would also assist the Tories in a manner similar to TV. It's one of the great myths of 1997 that TV was responsible for most of Labour's bonus seats. As far as can be ascertained, targetting was responsible for the majority of them, while possibly (I'd have to check) the opposite was the case with the LibDems..