


![[LibDems]](http://www.titanictown.plus.com/hp/LibDem.png)
![[Lead]](http://www.titanictown.plus.com/hp/lead.png)
The relevant bits:

"Electoral System: The first graph has been compiled from Anthony Wells' data for the new constituency boundaries. For each percentage point the LibDems might reasonably score in the range 15-25%, the outcome of the Election has been calculated for plausible Conservative LEADS ranging from 0-11%. The concept of Swing implies that the difference between the main two parties is important while their absolute level of support is not. So we can represent three vote variables with only two dimensions.
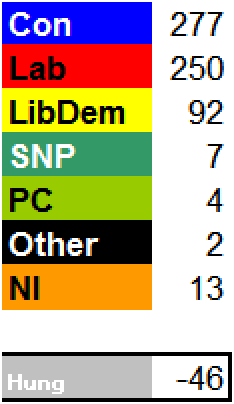
LibDems Kingmakers: The yellow region in the middle of the graph forms the area where the Liberal Democrats could combine with either main party to form a MAJORITY, irrespective of which party has the most seats. The black line that roughly bisects this area - at around a 6% Tory lead - is the point where the Tories would become the largest single party.
Labour or Tory Minority: The pink and pale blue areas are the regions where the LibDems alone could not combine with the second party to form a majority, resulting possibly (but by no means certainly) in a minority government formed by the leading party.
What is immediately apparent from the graph is the huge area which comprises a Hung Parliament in some shape or form. i.e. ALL AREAS EXCEPT THE DARK BLUE AND DARK RED AREAS.
How big is this area? The perhaps surprising answer is fully 75% of the battleground…
In other words, if we consider the graph as a DARTBOARD, and the Electorate a not very accurate dart-thrower, the chance of the dart landing in the “Hung Parliament” region is about 75%. This remarkable electoral landscape is unprecedented, and is a startling feature of contemporary British politics - with profound implications..."
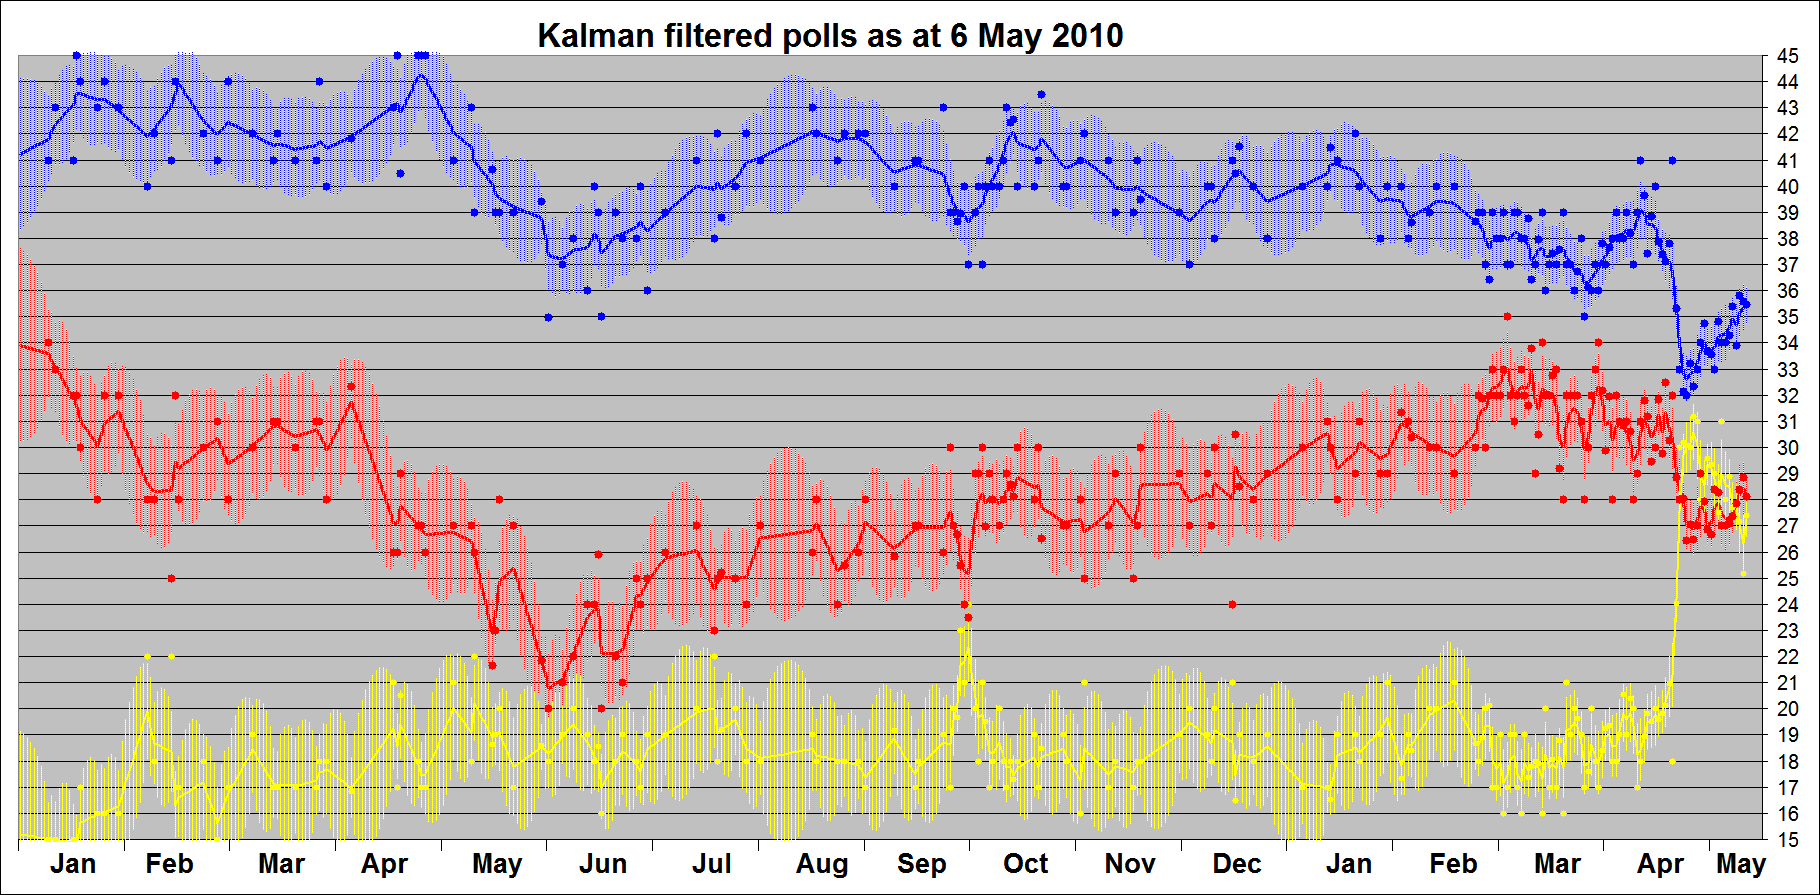
Of course, since that was written first Labour, then the Tories soared in the polls and a hung parliament started looking remote, but recently the polls have tightened again and the Tories cannot be confident of a majority. [I also now base my projections on the "official" Rallings & Thrasher notional results, which are near-identical to Anthony Wells' excellent estimates]
![Reblog this post [with Zemanta]](http://img.zemanta.com/reblog_e.png?x-id=d74a93ae-c5a1-476c-b2e9-063055b3d9d2)
I'll shortly update this graph with the R&T data, and use it as a background for a scatterplot of the opinion polls going forward to the election.
ReplyDeleteI remember reading your original article on PB.com - it is a classic. I look forward to your modified version.
ReplyDelete