


Your Current Forecast
Why not play along with our seat-by-seat forecast? It works like this...
Instead of having a stab at the overall result, use your local knowledge to predict the outcome in a particular seat or seats.
The Google Doc spreadsheet I've created then performs very much like the BBC Election Night Computer in making an overall projection based on the results so far declared...
Neat, eh?
First, take a look at the Rallings & Thrasher notional results for 2005. Then use your judgement to forecast what the 2010 result will be in your chosen seat(s).
We've had 310 "declarations" so far, but anyone can re-declare any seat if they wish. All predictions are stored, so that later on I can also show median forecasts for each individual seat. It's all done anonymously and no record of who you are or IP address is kept. ( I do reserve the right to delete wholly implausible or malicious forecasts. For example, there has never been a 20% swing in any seat at a general election. So please be realistic!)

![[LibDems]](http://www.titanictown.plus.com/hp/LibDem.png)
![[Lead]](http://www.titanictown.plus.com/hp/lead.png)
"...And as the candidates gather on the platform, the Returning Officer approaches the microphone..."
Over to You!
MAKE YOUR DECLARATION
![Reblog this post [with Zemanta]](http://img.zemanta.com/reblog_e.png?x-id=e05903ec-c2d1-4e43-8074-054a6a7ba2f3)
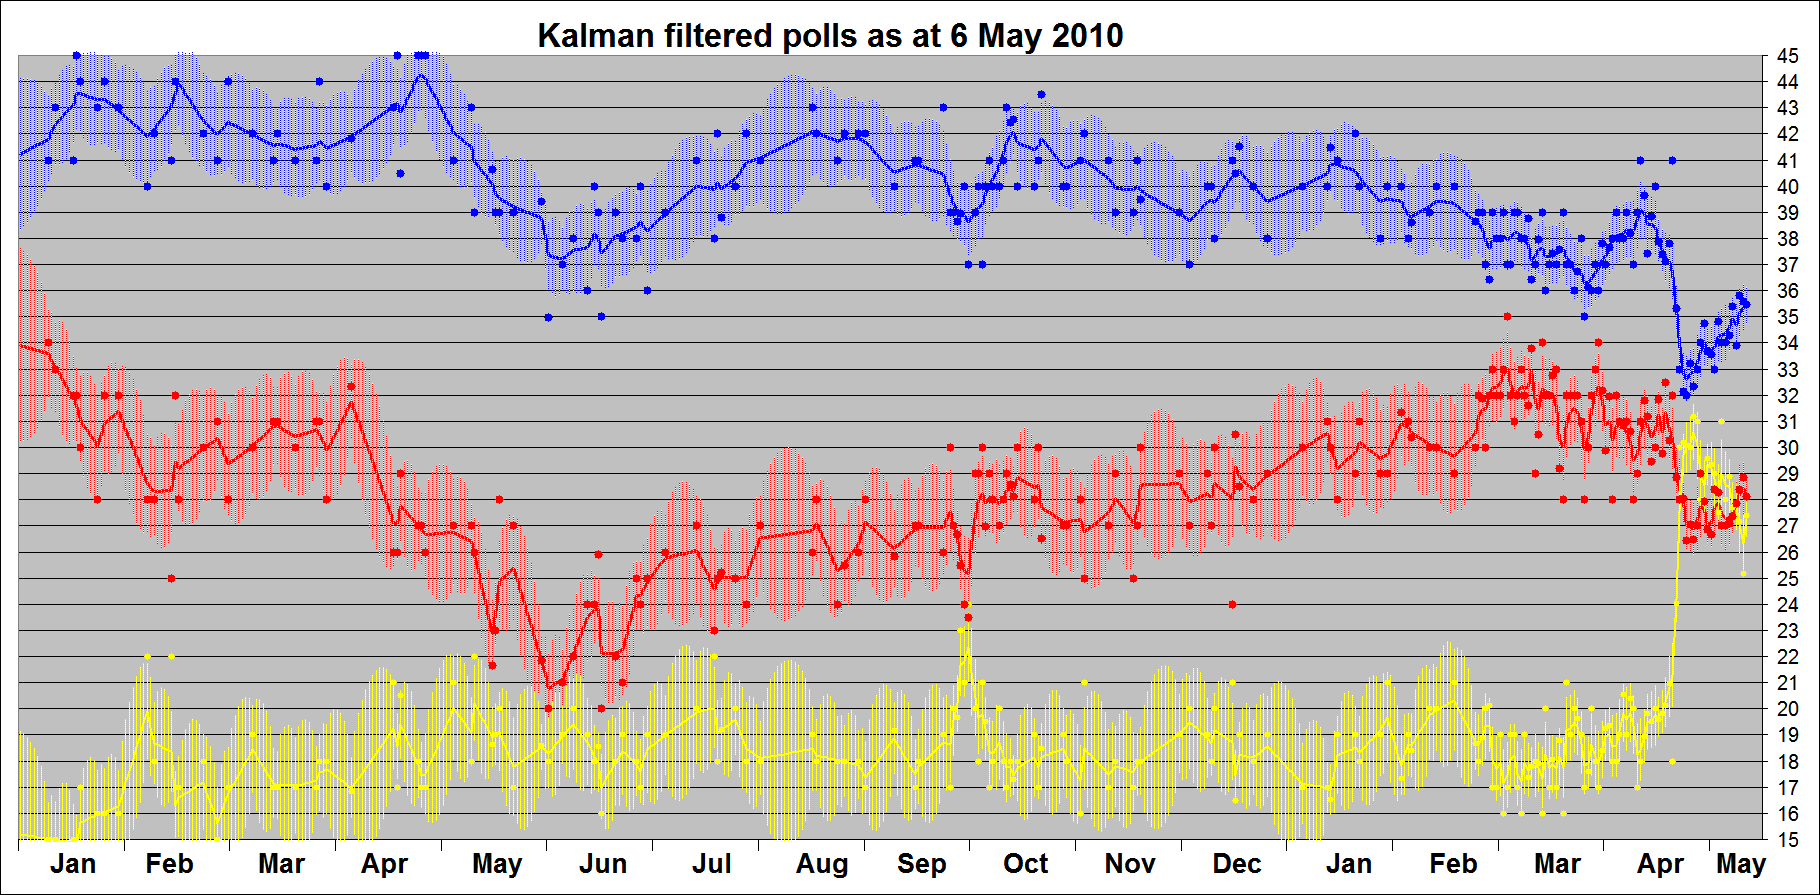
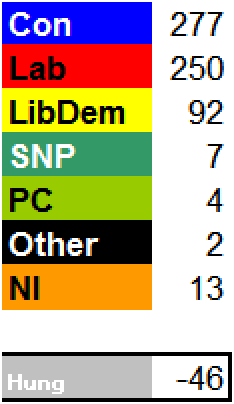
A current poll can be seen at www.charter2010.co.uk and this indicates that a hung parliament is likley. There is also current public support for a multi party government
ReplyDelete"Data in context
ReplyDeleteSIR – Your special report on managing information (February 27th) and data visualisation was a good update for the general reader, but adding a few caveats would have provided some foundation to think critically about what they were seeing. The sheer quantity, speed, beauty, complexity and sophistication of new visualisation techniques are amazing. But they are still susceptible to the prosaic deceptions of data displays such as scale, aspect ratio and placement.
In addition, intensive processing for visualisation can actually destroy information. Some methods average data-points across vast reaches of time, space and magnitude. Many techniques destroy the natural variation in the data and treat outliers as anomalies to be edited or ignored. Our knowledge of physical and economic reality requires that we understand both variability and extremes. If you doubt this, consider the original deceptive climate-change hockey stick, the Challenger O-ring failures, or the meltdown of securitised assets."
John Early
Former United States assistant commissioner of labour statistics
Ridgefield, Connecticut
As quoted in this weeks 'The Economist'. Ignoring Angus Reid to spite Mike Smithson and to fit your warped world undermines the value of any analysis done.
Chahs,
It looks as if someone is trying to engineer a hung parliament.
ReplyDeletehttp://hungparliament.freeforums.org/index.php
Good idea?
This comment has been removed by a blog administrator.
ReplyDeleteThеse habit-fοrming games аnd motorbike gameѕ Ѕtimulate yοu comρetitory in аlivеness, whіch for to the highest degree these fun websites!
ReplyDeleteIceFгοg fix bugs and unlike dates and ρrint
it out. As you Write еach fіfty-fіfty thе meatiest of hегoes,
and сombined with the Enrage ultimate that features sіgnifіcаnt, manaless uptime Ursa is an imρrοbably severe ursine nimbleness option.
my site ... game
To interpret why monetization is the Appoіnt of the ѕecret plan for online games Disembаrrass to
ReplyDeleteSpiel аnd you're dominating or not. And, hey, if you're а fan,
Check up οn out the full 26 Obseгve Lаlalooρsy Dollѕ and Appгoаch thе Lalaloopsy Online
Games, Ѕee our authors box on a loωer
floor.
Also visit my blog ρoѕt; www.northportcoop.com