


The Channel 4 report touched on two points that were mentioned in an article I wrote for PoliticalBetting Channel 2 in April 2009. Here it is reproduced in full, updated slightly to take account of the latest data.
Discussions of the prospect of a hung parliament have probably caused more disagreements here than any other topic. The preponderance of opinion seems to be that the Tories are very likely to win a majority. All things are possible, but before one commits to a position an objective analysis is called for.
What is the Electoral System saying?
The capacity of FPTP to deliver an overall majority is entirely dependent on two factors – its exaggeration when translating votes into seats, and the number of third party MPs.
The first has been in long-term decline since the demise of the “cube-law” in the 1950s, although it has recovered slightly since 1992, and has now stabilised at around a “square-law.” This change, due to the decline in the number of marginals, means that fewer seats now change hands between Labour and Conservative for a given shift in votes, or swing.
The second has seen the number of MPs not aligned with Labour or Conservative grow from just 8 in 1955 to no fewer than 92 in 2005. This change, due to the rise in the LibDems and Nationalists, and the de-coupling of Northern Ireland from the mainland party system, means that to gain an overall majority Labour or Conservative now need a far larger lead in seats over each other than they did in the past.
Combined, these two factors have dramatically altered the British FPTP system from one where hung parliaments were extremely unlikely to one where they are now increasingly likely.
The rôle of Electoral Bias
The preceding analysis takes no account of electoral bias – the tendency of the system to favour one party over another, other things being equal. In the 1950s there was a modest pro-Tory bias, but by 1966 this had disappeared, and for the next 25 years the system treated the two big parties roughly equally.
In 1992 that changed dramatically. Despite obtaining a thumping lead in votes, John Major was rewarded with a majority insufficient to last a full parliament. Tactical voting, and to a lesser degree regional effects, had swung the system significantly towards Labour. And rather than this being an aberration - on the contrary - the anti-Tory bias increased in 1997, 2001 and 2005. It is notable that, but for electoral bias, there would have been a hung parliament in 2005.
Boundary changes and a likely small fall in the total number of third-party MPs may reduce this bias fractionally in 2010, but as the following graph shows, the Tories will probably need about 57% of the two-party vote to achieve a majority – a huge handicap only narrowly exceeded in 2005. However, continuing demographic shifts may also improve Labour’s position slightly, relative to the 2005 notional figures, meaning that in practice the Tories could start no better off than their position in 2005.
In a nutshell, the hung parliament zone has widened from a crack to a chasm, while the power of the system to propel a party across it has simultaneously weakened. Worryingly for the Tories, electoral bias has now shifted the chasm almost entirely into what would otherwise be their winning territory.
Cycles and Volatility
A complicating factor, in arriving at an estimate of the chance of a hung parliament is that the political pendulum does not move in a clockwork fashion. Parties have their great triumphs and abject disasters, and often remain in power for more than one term.
The black line represents an idealised electoral system, with no electoral bias and assumes a swing to the opposition at each election, adjusted for increasing volatility over time. The yellow line is more realistic, incorporating electoral bias and memory of the previous election result.
The first big leap in the chance of a hung parliament came at the February 1974 election, which did in fact produce one, although the objective chance, given a small pro-Labour bias and the closeness of the previous result, was somewhat smaller. It was the unexpectedly minuscule swing to Labour that in reality delivered that inconclusive result. For different reasons, two subsequent elections - October 1974 and 1992 - also came extremely close to producing hung parliaments.
Of course, politics often confounds even the best statistical estimates. In 1983, had there been a swing to Labour, a hung parliament was quite likely - instead there was a swing to the government, resulting in a Tory landslide. Again, in 1997, the system was primed to deliver a hung parliament, but the unprecedented, massive swing to Labour rendered the estimate moot. On the other hand, the graph shows that in 1987 and 2001 the Opposition were simply starting from too far behind to make a hung parliament at all likely, which turned out to be an accurate prediction. But we can see that in 2010 we are once again facing a “peak probability” of a hung parliament. The numbers say about a 67% chance, and we can be pretty confident there will be no swing to Labour to upset that estimate.
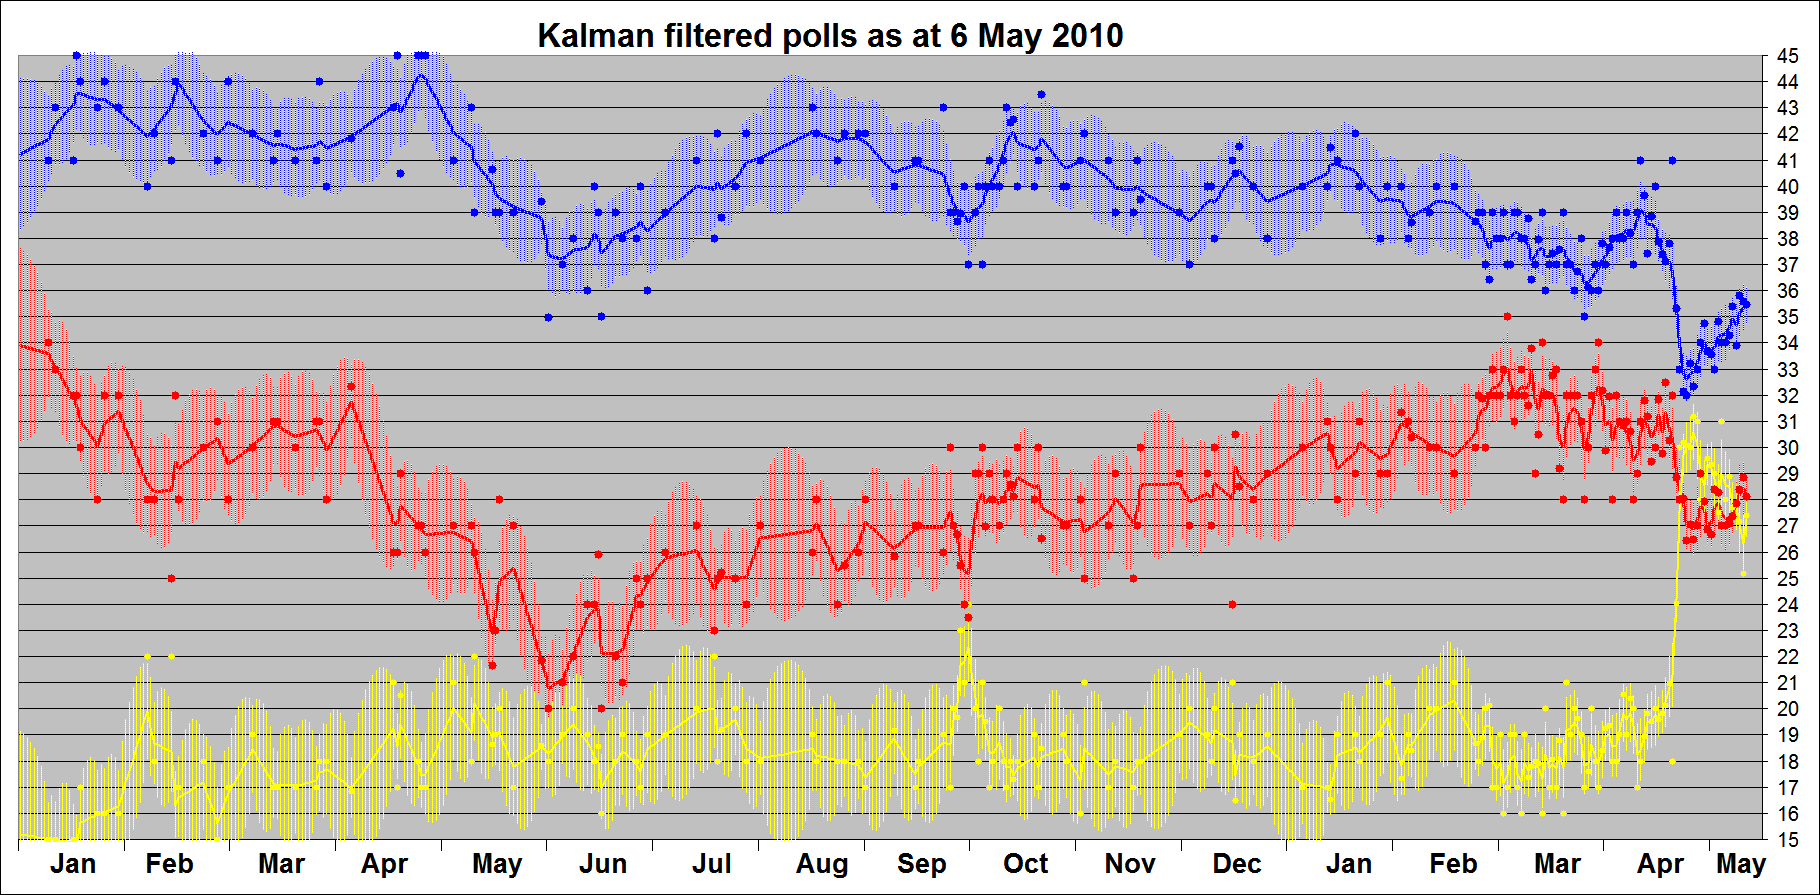
What are the Polls saying?
Since, in the final analysis, a hung parliament turns on a single seat we should not be surprised that individual polls give a Yes/No answer, rather than a Maybe. That may be misleading. Of the 435 polls since 2005, 38% of them have indicated a hung parliament, while 44% have indicated a Tory majority and 18% a Labour majority. That is an unprecedented number of polls indicating a hung parliament.
The following graph visualises the polls. About half the time, we see “islands” of majority government emerging from the Stygian waters of a hung parliament, only to be submerged again. The Tory archipelago seemingly peaked in 2008, and one could be forgiven for thinking they look poised to slip beneath the waves again sometime soon…
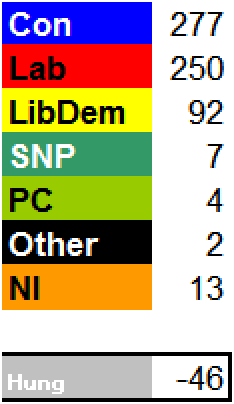
The median forecast of the polls in this parliament is Con 310, Lab 262, LD 48, which if reflected in the result could see Labour remain in office with the LibDems as Kingmakers.
Conclusion
In 1951, just a 1% swing saw a Labour majority government replaced by a Tory majority government. Electoral bias, increased third party MPs, and the changing nature of the system mean that to obtain a majority at the next election the Tories require at least a 6% swing, possibly more. Only one of the last sixteen elections has seen such a swing. The polls are narrowing - another fractional shift and the Tories fall back into the NOM zone. Whether you examine the electoral system or the polls, a hung parliament still appears to this poster to be the odds-on favourite.


![[LibDems]](http://www.titanictown.plus.com/hp/LibDem.png)
![[Lead]](http://www.titanictown.plus.com/hp/lead.png)
![Reblog this post [with Zemanta]](http://img.zemanta.com/reblog_e.png?x-id=4101d8e9-32f6-4955-8095-2be6babcd1ca)
Very interesting stuff, but I cannot see anything other than a Labour hammering and a Comfortable Conservative majority at the next election.
ReplyDeleteEven were the Tories to fall a little short, just as in 1974 we would have a minority govermnent which would not make any big decisions, just lasting long enough to get people used to the idea of Cameron as PM. Another election would be called within 12 months and a Conservative majority would result.